Circos Interface Make your own Circos
The Interface
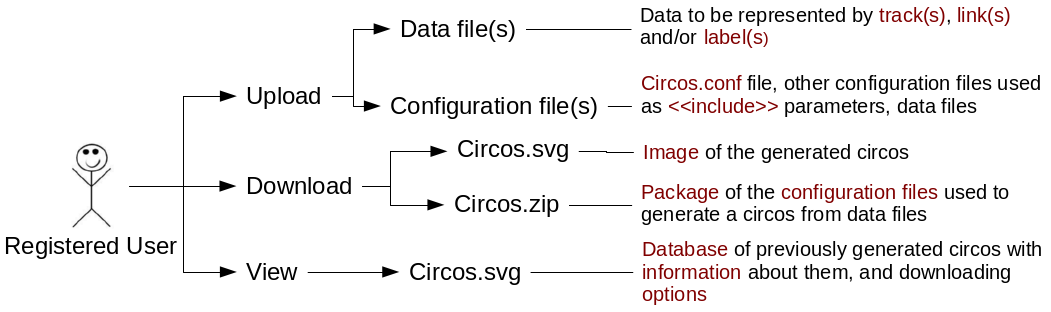
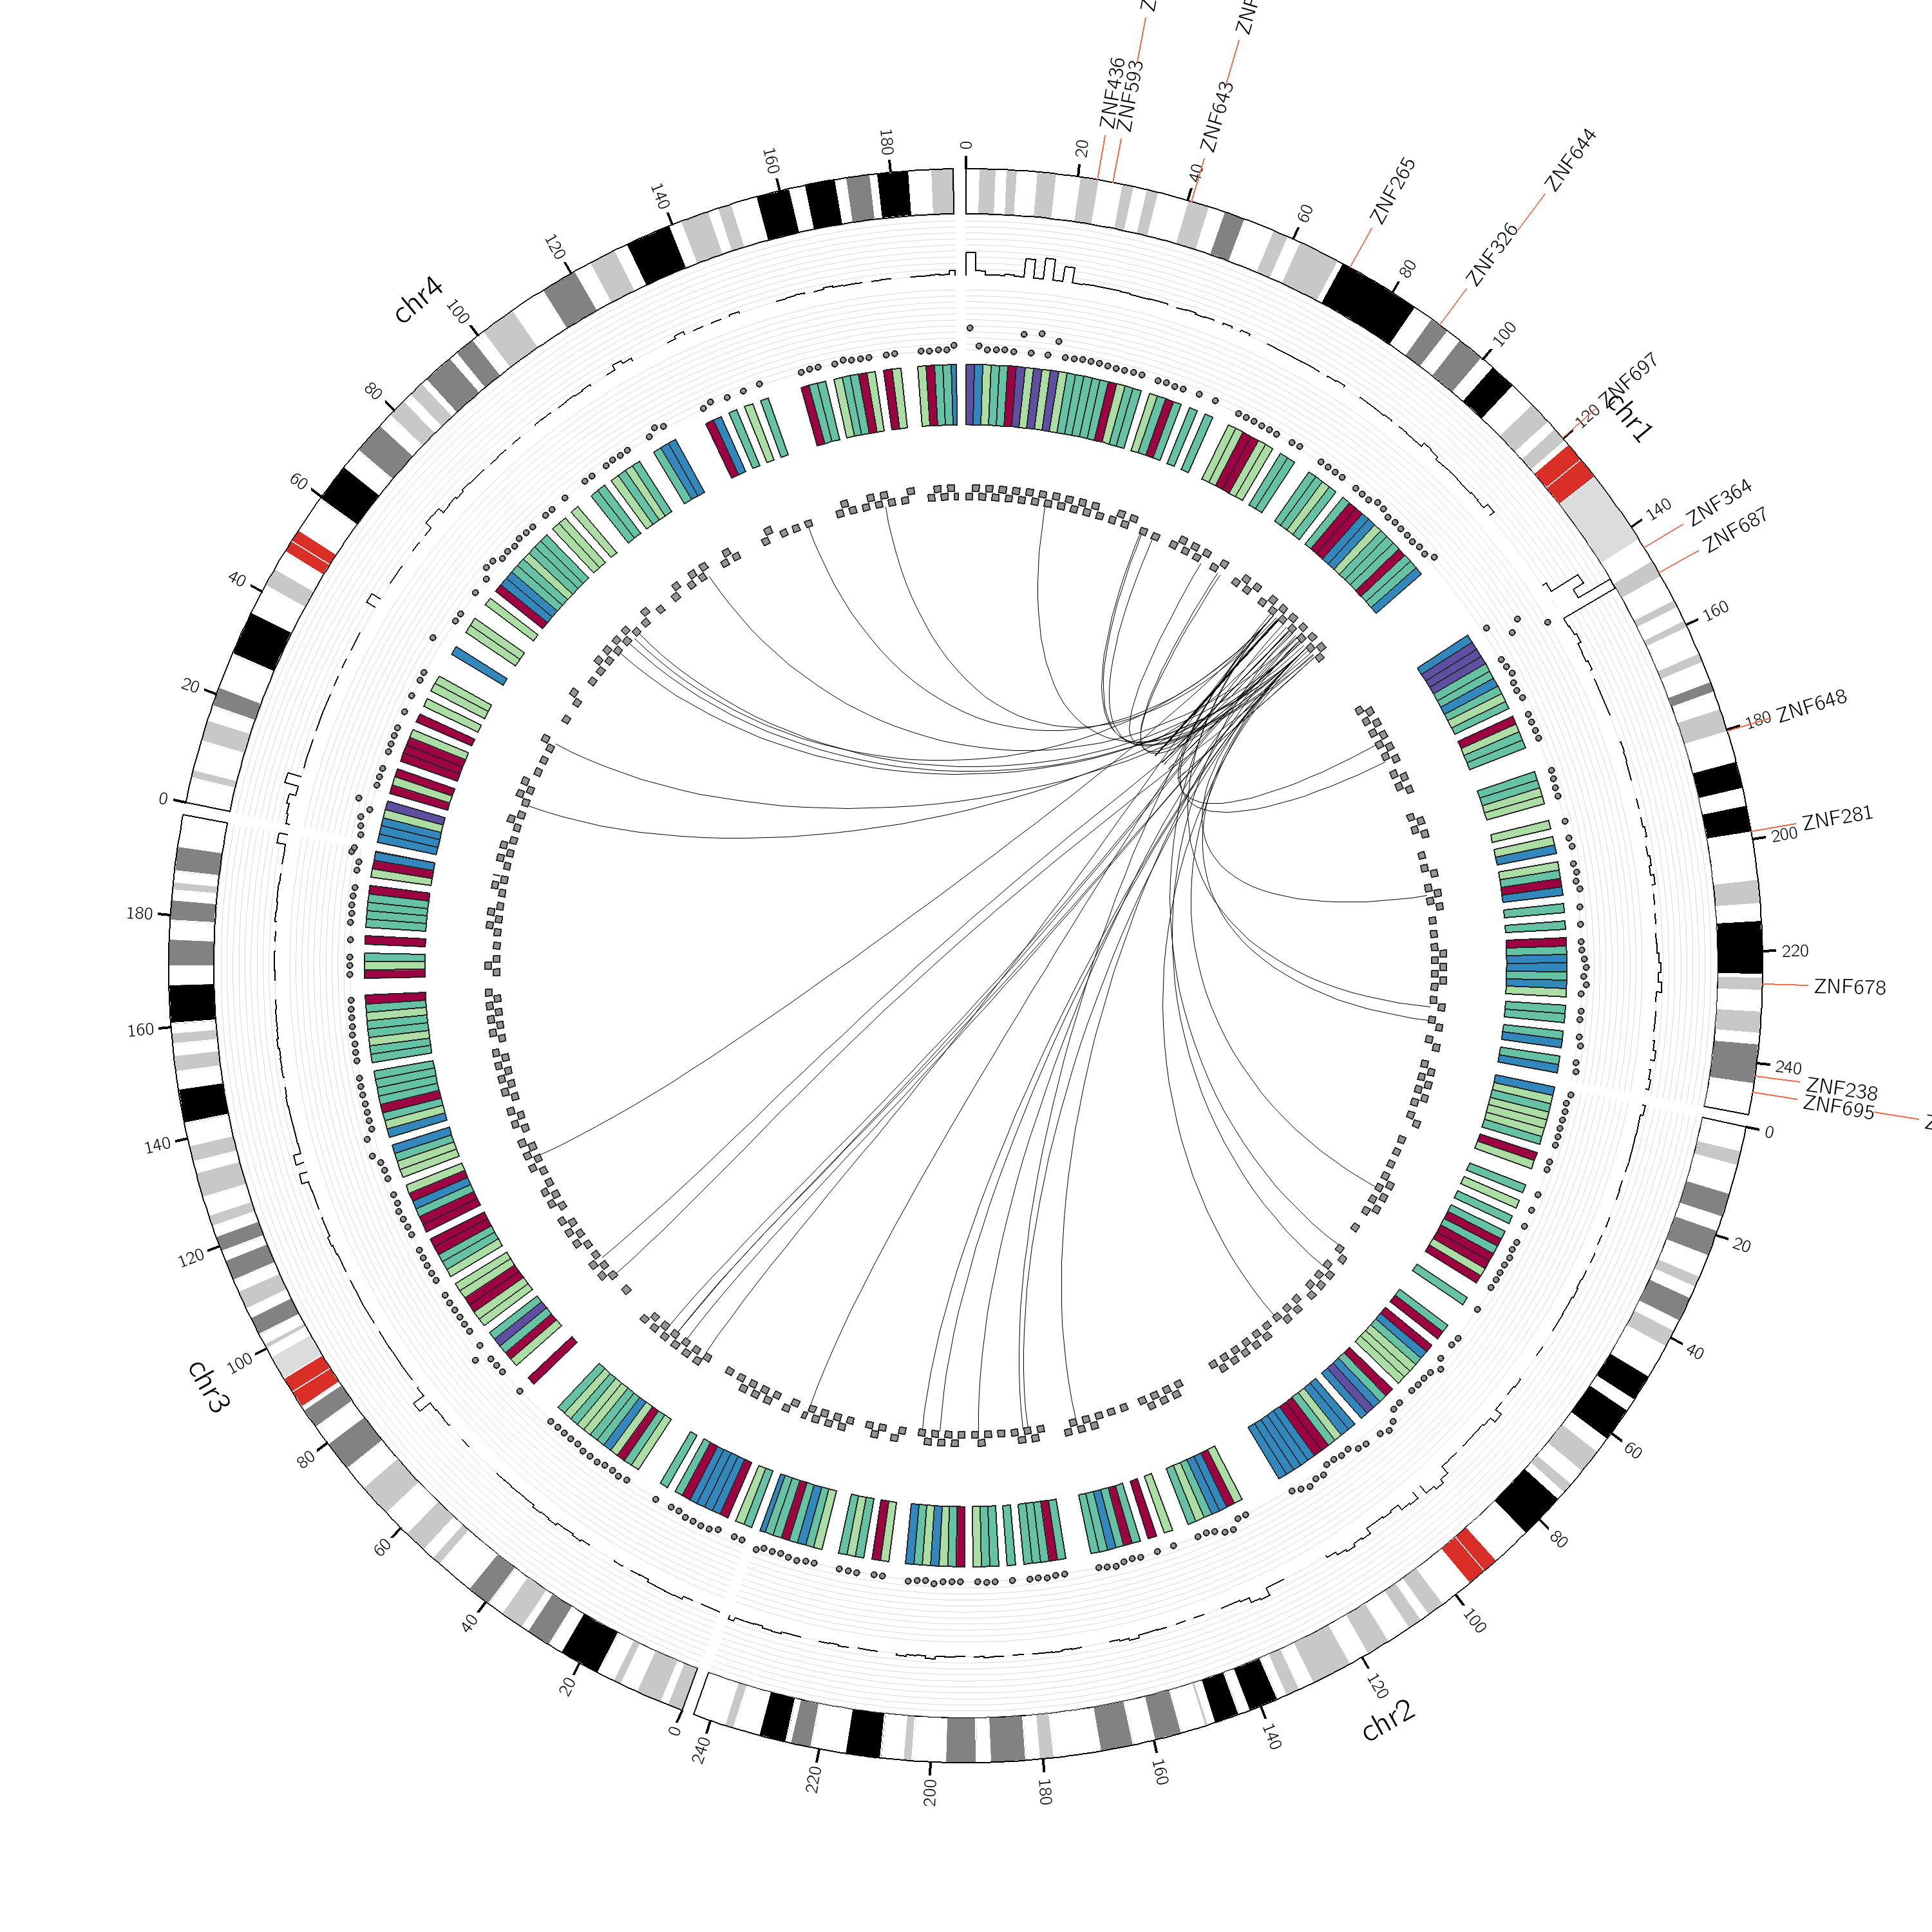
This interface aims to be a user-friendly tool when doing circular data visualization, a.k.a Circos1. There is no need in downloading or installing the Circos software package: you only have to upload your file(s), select some parameters if needed and click on Generate. The interface will keep track of all generated images and their associated details. Therefore, when logged in, you can access a database of your own Circos.
Circos can be used to display any kind of information. It's particularly suitable for layering different data sets to create highly informative infographics with texture and visual appeal.
- M. Krzywinski
You can either upload individual data files, which will represent track(s), links or labels on the final image, or a zip/tar package. The Circos generated can then be downloaded, as well as the configuration package specific to it. The image is outputted as a SVG and therefore can be modified in any image manipulation programs. Directive and tips are listed under the Help option in the menu bar.
For more information about Circos, the user can refer to their website
1 Krzywinski, M. et al. 2009. Circos: an Information Aesthetic for Comparative Genomics. Genome Res, 19:1639-1645.
Start Now!